10.23.26 Tredas Weekly Recap
Weekly Action:
Dec26 Corn down 18.25 at $4.56
Nov26 Beans down 3.75 at $12.5750
Dec26 Chi Wheat down 35.5 at $6.25
Dec26 KC Wheat down 40.0 at $6.64
Dec26 Cotton up 27 points at $0.8027/lb
Dec26 Hogs down $1.350 at $65.575
Dec26 Fats up $2.775 to $231.125
Nov26 Feeders up $6.225 at $348.125
Dec27 Corn down 11.75 at $4.95
Nov27 Beans down 9.75 at $12.31
Jul27 Chi Wheat down 36.75 at $6.4625
Jul27 KC Wheat down 41.25 at $6.8050
Dec27 Cotton up 25 points to $0.7925/lb
Grains:
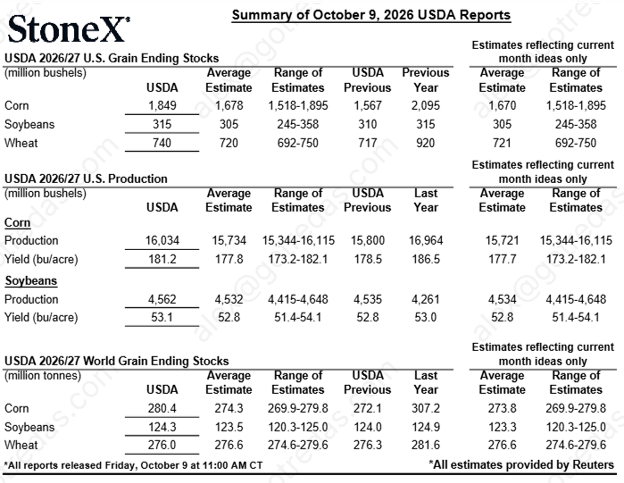
Corn and soybean futures faced continued pressure this week as harvest activity picked up across the Midwest, with favorable weather allowing combines to keep rolling and seasonal selling weighing on prices. December corn slipped toward $4.60, testing support near the August lows as the market continues to work through expectations for a large U.S. crop, or so the USDA says. Weekly export sales improved to 60.1 million bushels, up 36% from the previous week, although actual export shipments slowed considerably. The market remains oversold, but it will likely take stronger demand or a shift in the technical picture to sustain a recovery.
Soybeans also struggled for much of the week, with November futures trading near $12.50 and heading toward a second consecutive weekly loss. Harvest pressure and large crop expectations continue to weigh on prices, but a significant improvement in export demand provided a bright spot. USDA reported 104.4 million bushels in weekly soybean export sales - the largest weekly total since November 2023 - with China accounting for the bulk of the purchases. Moving forward, we’ll be watching whether that demand can help stabilize prices as harvest winds down.
Government Programs:
The 2026 ARC/PLC election closes December 11. Farms that make no election stay on their 2025 choice but aren’t eligible for a 2026 payment. Most producers stick with ARC-CO or PLC, but ARC-IC (Individual) deserves a look this year. It measures your own yields against your own five-year history (2020-2024) instead of the county’s.
· It follows your farm, not the county. It can pay when your yields came in well below your own history, even if the county and prices held up.
· The tradeoff: It guarantees 90% of your own benchmark revenue but pays on 65% of base acres, compared with 85% for ARC-CO and PLC. That makes it a better fit for a farm-specific shortfall than for a broad price drop.
· It’s chosen by farm number (FSN). It covers all crops on that farm, and every producer on the farm must agree (including other tenants if applicable).
· It requires good records. Yields by field have to be documented and may be checked.
What we need from you:
1. 2026 FSA-156EZ for every farm number (your FSA office can email them).
2. Your crop insurance production history (APH) for all units, from your agent (if not Tredas).
3. Your 2026 acreage report (FSA-578), or planted acres by field and crop (if not Tredas).
4. 2026 harvest yields by field (settlements, scale tickets, grain cart weights or yield monitor reports).
Send what you have as you get it, and we will tell you which program fits each farm.

Carbon intensity (CI) scoring is moving from talk to dollars. Elite Octane (Iowa) has published a 2026 corn premium schedule that pays by CI score, from $0.05 up to $0.60 per bushel, and other buyers are starting to publish programs of their own. A CI score is the grams of carbon dioxide equivalent emitted to grow a bushel of corn, and a lower score pays more. USDA’s calculator builds the score from your county, yield, nitrogen rate, tillage and cover crop. The national average for corn is about 6,020.
· What moves the score. No-till and cover crops do most of the work because they store carbon in the soil. Nitrogen per bushel and yield come next: about 10 lb less N cuts the score roughly 190 g/bu. Scores vary by county, so a farm in central Nebraska won’t score the same as one in southwest Iowa.
· What it pays (Elite as the example). On a southwest Iowa field making 200 bu/ac with 150 lb of nitrogen, Elite’s schedule pays about $0.05/bu ($10/acre) for conventional tillage, $0.16 for a cover crop alone, $0.25 ($50/acre) for no-till, and $0.43 ($86/acre) for no-till plus a cover crop. In their schedule, every 1,000 g/bu you cut is worth about $0.10 per bushel.
· What it takes. Run the USDA calculator for each field, back up no-till with USDA’s tillage tool, keep field records for five years, and write a nutrient budget before you apply fertilizer. The buyer arranges a third-party audit. Elite’s reports are due Feb. 1, 2027, enrollment is first come, first served, and 2026 corn is paid in July 2028.
Other buyers, such as ADM, have published tiers of their own, from $0.05 to $0.25 per bushel, so expect premiums to differ plant to plant. The federal 45Z tax credit behind these programs isn’t final yet, so terms could change.
This tool mimics the USDA calculator that you will use to create your C.I. Score.
Figures are estimates, not guarantees. Each buyer sets its own terms, and official scores come from USDA’s calculator.
Livestock:

Weather:
The latest 7-day precipitation outlook shows rain returning to much of the western Corn Belt, with the heaviest totals expected across parts of Nebraska, Kansas, and into the western Plains. With harvest in full swing, this could slow progress and create some delays.
The eastern Corn Belt looks considerably drier, so harvest progress should press on. If the wetter forecast verifies in western Corn belt, it could provide some short-term support to nearby basis.

Something That Probably Means Nothing:

Quote of the Week:
Please put an end to these political ads on tv and mailers in our mailboxes - Everyone
Thanks and have a great weekend!


Comments